

If you want to improve your Twitter account and grow your following, the best place to start is by looking at your analytics. So let’s talk about what analytics are, how to find them, what they mean and why they are useful.
What are Twitter analytics?
Twitter analytics are a selection of statistics that tell you information about how well your account is doing, who your followers are and what content is performing the best. They look at your account as a whole, showing you monthly stats and custom date ranges. From analytics, you can see how many people are seeing your content, how many new followers you have and how many people have visited your profile, as well as much more.
How do I find Twitter analytics?
Using the newest version of Twitter, you need to click the drop-down arrow on your profile information at the top right, then from here select the Analytics option. This will take you to a home page that summarises the current month and gives you the option to enter into the realm of analytics and truly understand your data.
Explaining the Twitter analytics ‘Home’ page

When you enter the home page you’re met with your stats for the last 28 days. Needless to say, a green arrow indicates growth, a red arrow indicates a decrease.
• Tweets is fairly obvious, the number of tweets you have posted over the 28 day period
• Tweet impressions refers to the number of times your tweets have shown up in user’s timelines. Every time this comes up in a timeline it counts as 1 impression, but this doesn’t mean your tweet was necessarily seen.
• Profile visits tell you the number of users who visited your profile over 28 days.
• Mentions is the number of times your username was mentioned using @ by another user.
• Followers shows the number of followers you have as of now.
You can then see this summary broken down month by month if you scroll down this page. Sometimes these results aren’t entirely accurate, but it’s good to get an understanding of what months did well for you and work out why.
In these month views, you’re able to see:
• Top Tweet refers to your tweet of this month that received the highest number of impressions.
• Top Mention is the tweet that mentioned your username with the @ and received the highest number of impressions.
• Top media Tweet is the tweet with a photo/video that received the highest number of impressions.
• Top Follower is the account with the highest follower count that has followed you this month.
Explaining the Twitter analytics ‘Tweets’ page
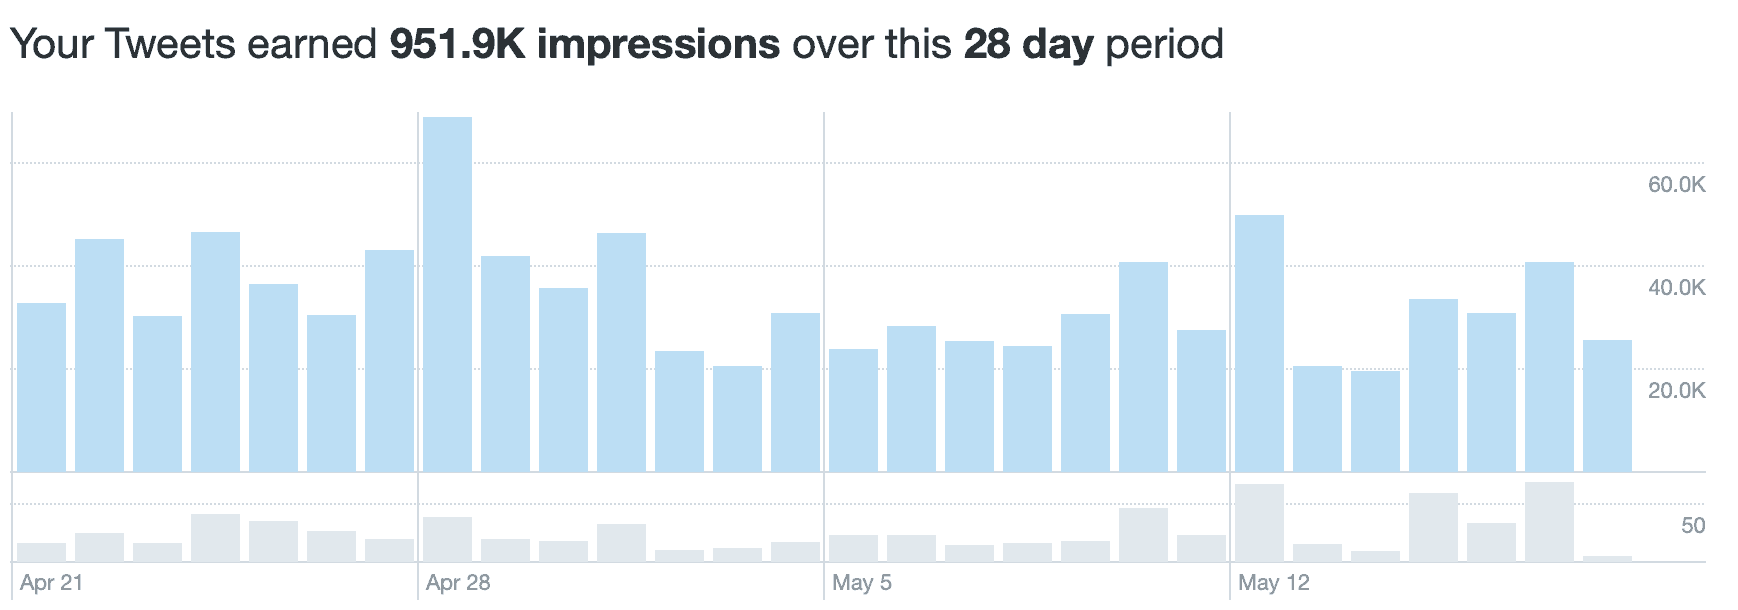
This page is probably my favourite, it’s where you can see how each individual Tweet you posted did. You can filter this page by Tweets, Top Tweets, Tweets and Replies or Promoted.
The default view for this page is 28 days, but you can change the dates using the calendar selector in the top right corner.
I personally like to filter by Top Tweet so I can see which posts of mine did the best and how I can adapt them for the future. Here’s an example of a popular post I published in February 2019.
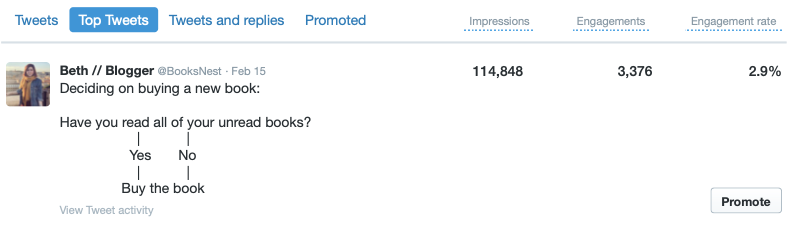
From a glance, you can view your impressions, engagements and engagement rate. We’ve already discussed impressions, but what is engagement?
Engagement refers to the number of users who have engaged with your post by doing any of the following; like, RT, reply, follow, click. To get the engagement rate, you simply divide the number of engagements by the number of impressions – this will show you the average of how many people that have the chance to engage with your post actually do.
You can get more specific stats by clicking into the Tweet of your choice, where you can view the number of likes, retweets, profile clicks, replies and follows.
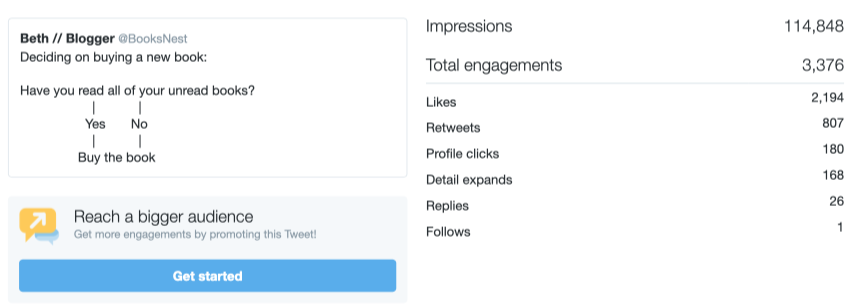
This is really helpful to view when it comes to understanding what content did well and how users liked to engage with it. It’s also 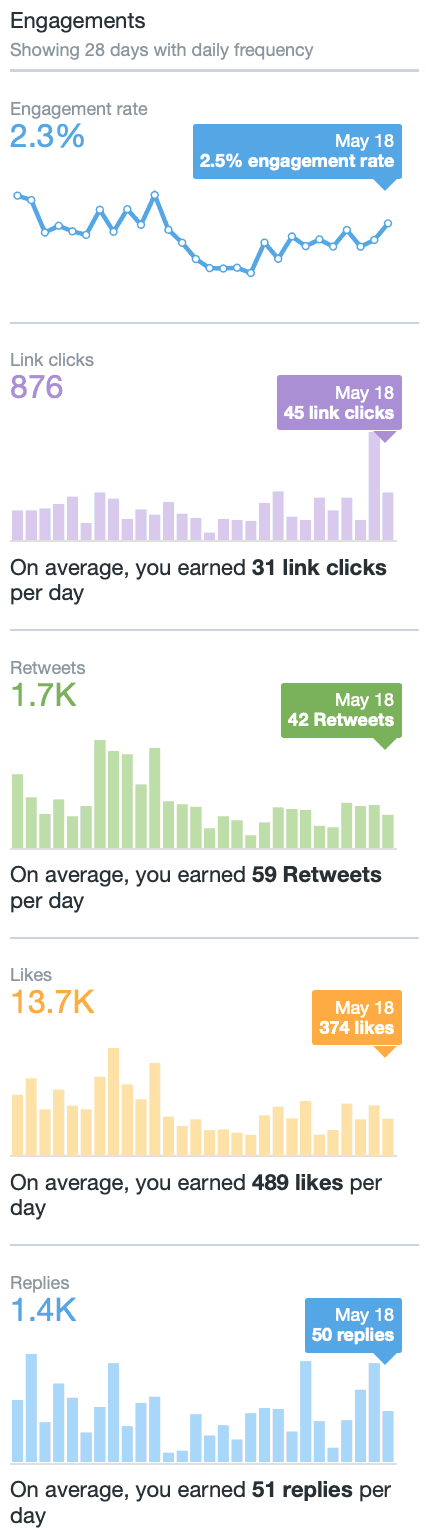 useful if you want to promote a post, you can see which did the best and would work well with paid incentive.
You can see a more detailed view overall of your engagement for your selected date period on the right of this page.
This information gives you an overview of all of your engagement from the selected date range. This collects data from every tweet posted within this time and shows you the total numbers for engagement rate, link clicks, retweets, likes and replies.
This is also a handy feature because it tells you your average stats per day. These are useful numbers to be able to provide if you’re looking to work with brands and is perhaps something to include in your media kit if you have one.
Generally, I find this whole tab very useful and it also reminds me of posts I did months/years ago that did really well. It’s a brilliant source of inspiration for me, so this is my go-to place when I look at my analytics.
Explaining the Twitter analytics ‘Audience’ page
I’ll be honest, I don’t tend to use this page very often because I tend to assume if you’re following me on Twitter, it’s probably because you like books. But, this is a handy tab for business and brands who want to really get to know their audience.
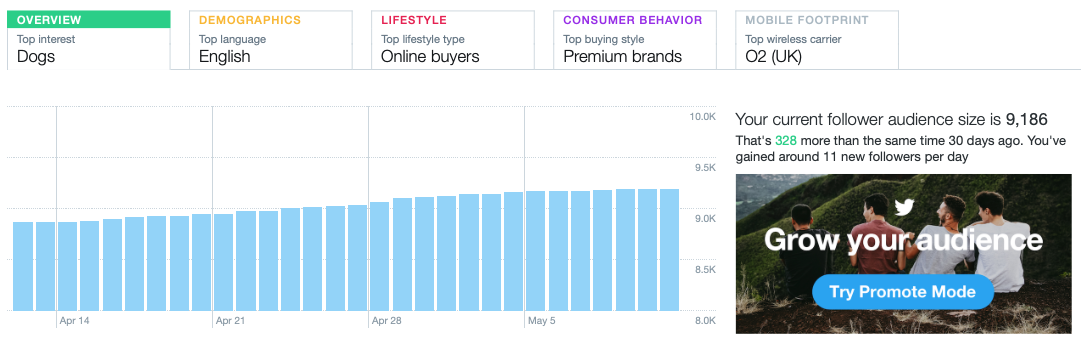
From these stats, you can see your audiences top interest, top language, top lifestyle type, top buying style and top wireless carrier. So as you can see, if you’re not really selling your audience anything, it’s not quite so relevant.
BUT, this does offer you valuable insights if you wanted to tailor your content. For example, I can see my followers top interest is dogs, so I could start posting more about dogs. If you noticed most of your followers were French, could you post a Tweet in French? Maybe not, but the point is, you can now adapt your content to suit your audience should you wish to.
As a blogger, I am always shaping my content and making it the best it can be. But I always write what is true to me and what I love, so if I see my follower’s top interest is bikes and I don’t have a clue about bikes, that doesn’t mean I’m going to post about them. It’s all down to personal preference and how you want to meet your audience’s needs. If anything, this tab could serve as inspiration for new content should you need it/wish to push yourself.
Explaining the Twitter analytics ‘Events’ page
Lastly, we have the events page, another tab I don’t really use. But if you’re a brand/business and you want to tap into the community around you, this page is very handy.
At a glance, you are offered an overview of upcoming events, where they are, how many tweets have been sent about them and how many people these tweets are reaching.
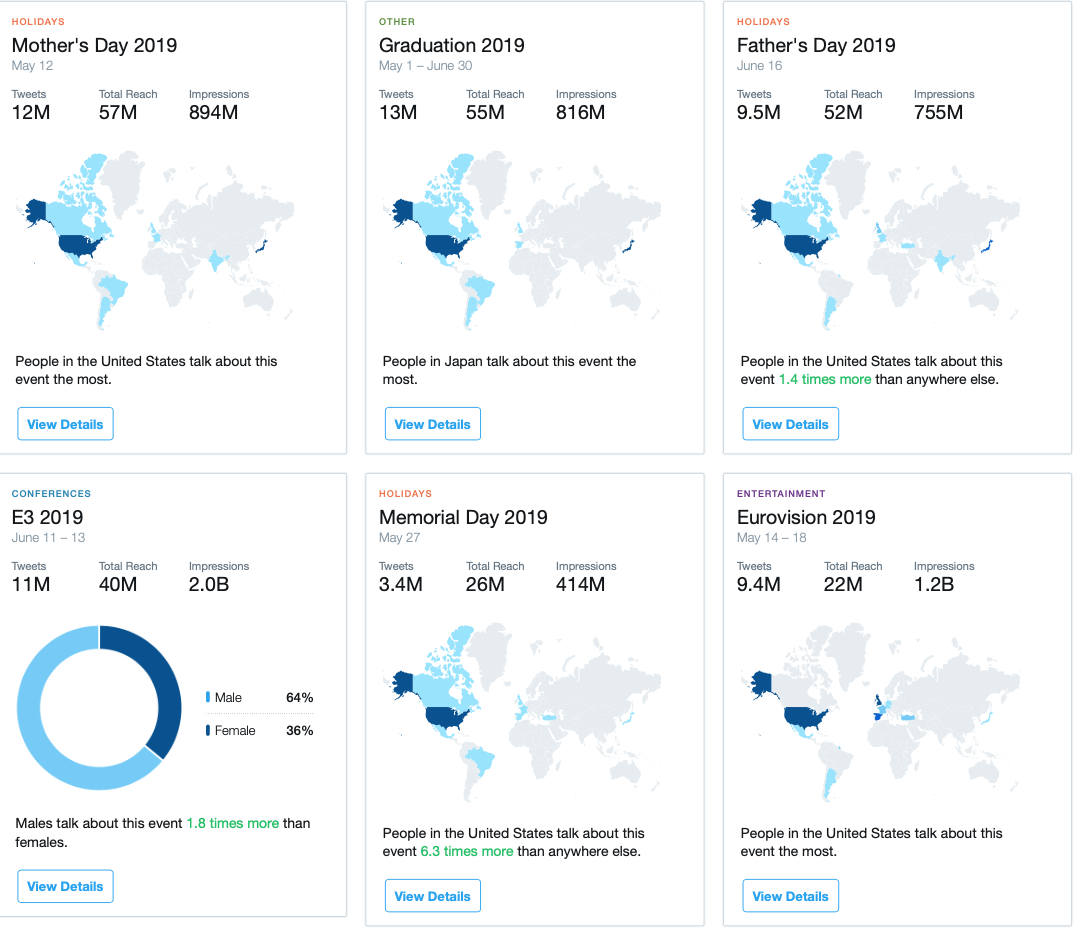
You can then go into tabs to view these events in more detail by category, date, location etc. As I said, I think this is more relevant if you’re trying to tap into a specific market, but it’s still handy to know this feature exists.
This blog has post has been my overview of Twitter analytics and how to understand them. I hope this has offered help to at least one of you! If you want to learn more about growing your Twitter following, I have some tips on that too.






This is such a useful thing to know! I knew twitter analytics existed but I’ve never actually tried to use them, so now I’m interested to see what my stats show about my account. Thanks for the helpful information!
This is such great information! I have looked at my Twitter analytics once or twice but honestly didn’t know what to do with them. Thank you for this post!